Showing posts with label Census. Show all posts

2010 U.S. CENSUS: Latino Advert

While working as Associate Creative Director at Shilo, Changethethought partner Mike Slane co-directed and lead animation efforts for this fun and playful broadcast spot for the 2010 U.S. Census. Focused on the latino audience, this spot combines live-action, character design and inventive animation to create a city made of clay.


The advert targets America’s Latino population, which consists of nearly 47 million people and comprises the country’s second largest (and fastest growing) ethnic group. It would be nice to see a similarly creative advert for the forthcoming UK Census, perhaps developed by squintopera or such like...
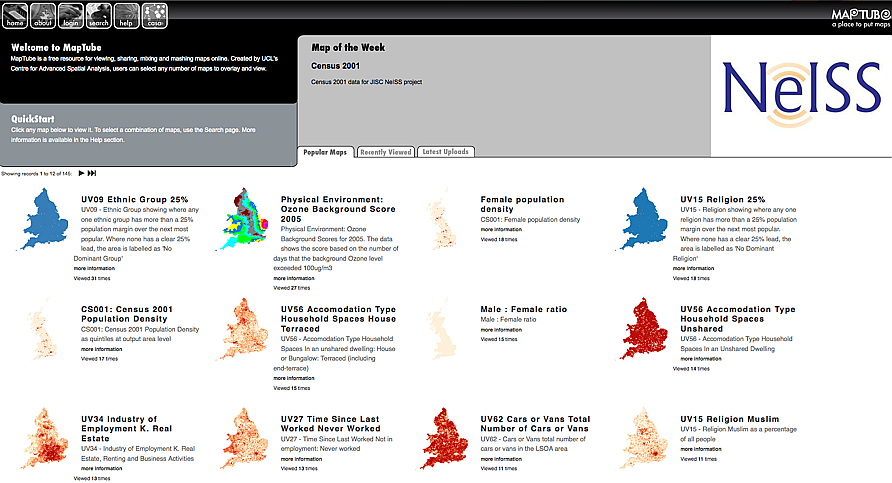
MapTube: Now with 145 Census Maps

As part of work on the JISC funded National e-Infrastructure for Social Simulation project, CASA has put online 145 census maps. Running within the MapTube system, each map can be mixed and matched with any other map to create unique overlays.


The system was developed as a quick and easy way to view maps of census data without having to go through a slow cumbersome list of drop down boxes only to be left with a .shp or .csv file to download. Future versions will include direct links to the raw data and the possibility to directly query the fields.

Of note in the development cycle of MapTube, each map is now created dynamically, this is in preparation for a new 'mapping service' which will be open to beta testers in early 2010.

You can take a look at the maps via http://www.maptube.org/census/

Population Density: Google Maps Census System Preview

At the moment here at CASA we are working on a phase one deliverable of a new grant entitled NeISS - National e-Infrastructure for Social Simulation. Funded by the JISC as part of its Information Environment Programme it will provide a platform to meet the demand for powerful simulation tools by social scientists, public and private sector policymakers. Social Simulation is an expanding field due to its forecasting applications for scenarios in transport, housing, education, healthcare etc.

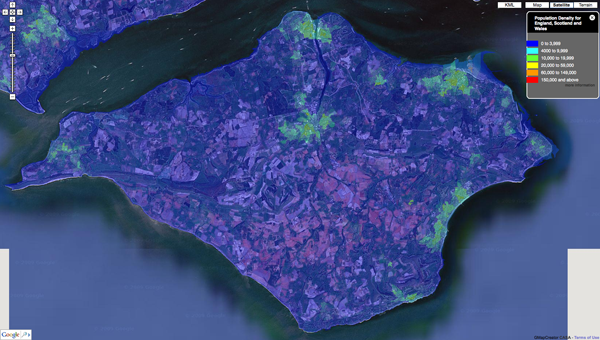
Our first of many outputs is to visualize the UK Census data via MapTube and we thought we would share some of our first results as they make for quite intriguing images - such as the screen grab below detailing Population Density of the Isle of Wight:


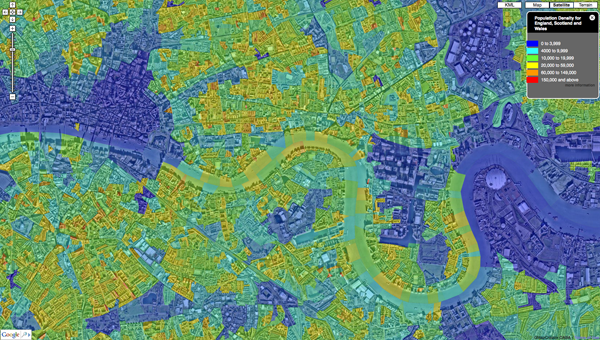
The work is ongoing with the ability to 'click' on areas and view the underlying data as well as data streaming and varying levels of detail all forthcoming. Countywide, zoomable down to local level Cenus data is hard to come across, for a quick view is provides quite a good way to identify pattens in the urban landscape. Below is Central London:


Our back end system under development means that the output is not limited to the UK Census, it would be interesting to make this a global tool, more on this in future posts...

You can see our sample map of Population Density direct via MapTube.

US Census Drop's PDA, Adopts Pencil and Paper

Sometimes it is easy to overlook how good 'old' style technologies are. For example, pencil and paper has automatic 100% handwriting recognition, is zoomable, viewable from any angle in any light conditions and is compatible with any number of filing systems.

As such the US Census Bureau will be ditching its PDAs in favor of paper and pencil for the 2010 census. To be honest this makes sense on a number of levels.

Sure it goes against our natural urge to geo-tag, document and process data on site via an edge connection, preferably while streaming video, but sometimes its easier to go old school.

We are just looking at our gps pda enabled mapping system for a campus route finder and thinking it might be better to use paper, a pencil and a compass - this could catch on.

Picked up via Engadget..