Showing posts with label Twitter Data. Show all posts

Data Space: Agent Based Models, SketchUp, Visualisation, ArcGIS and Lumion

Over the past few weeks we have been exploring exploring new methods and techniques for visualising data. Developed as part our Masters course in Advanced Spatial Analysis and Visualisation we are now looking into issues of scale, realtime rendering, rapid visualisation and 3D exhibition spaces.


Regular readers will know we have been exploring Unity due its interactive nature and ability to import various file types into its game engine (see Particles, Agents and Emergent Behaviour ). Unity is still an option but for rapid visualisation Lumion also offers distinct possibilities. The movie below details our first draft example of building an exhibition space (SketchUp), retexturing and adding various crowd/delegate models (3DMax) and the Twitter map (ArcGIS) using Lumion:


If Lumion offered a stand alone viewer rather than purely movie based output then it would be our engine of choice. As such it is currently a weigh up between Lumion and Unity, our Unity example is under development, we will post it soon as we can...

London Twitter Cloud Updated Movie

An update movie on our data collection via Twitter in association with urbantick. The data covers a weekend period from Friday evening to Monday morning containing 380,000 individual tweets. Within these 60,000 were geo-referenced, tweeted by 5,500 individual users.


The movie clip uses Google Earth to visualise the data:


Music - Becoming Visible by Xanthe on MP3 Unsigned.

Note the 'tweets' at Heathrow and how you can almost pick out London's shape via the twitter cloud alone. The original movie can be found here.

London Twitter Cloud

Regular readers will know we have been logging data in 12 cities via our Tweet-o-Meter, its still early days but the results for a weekend in London are intriguing.


The data covers a weekend period from Friday evening to Monday morning containing 380,000 individual tweets. Within these 60,000 were geo-referenced, tweeted by 5,500 individual users.

In terms of density the focus is on central London with local hotspots as the weekend progresses, around Kings Cross and Old Street. There is also a noticable trace along the main transport routes into and out of town, noting that we seem to be tweeting while on the move. The clip below details the visualisation in Google Earth:


Music - 'Social Awkwardness' by Xanthe  over on unsigned bands.

The clip reveals a message cloud rising and hovering above London as a time-space aquarium where the time is plotted as the height information. Interestingly Google Earth is becoming the visualiser of choice for such data sets, the combination of location, imagery with the ability to view by time makes it a formidable engine for data visualisation.

Thanks go to urbantick who converted the data via a custom VB script.

Steam Punk Beta Tweet-O-Meter

As regular readers will know our Tweet-o-Meter features tweets per minute within a 30km area of New York, London, Paris, Munich, San Francisco, Barcelona, Oslo, Tokyo, Toronto, Rome, Moscow and Sydney.

Ben Blundell, here at CASA, has taken some time off from our TOTeM project and has hooked up a series of panel meters to the script via a custom arduino module. The result is a suitably 'steam punk' version of Tweets per minute in New York, London and Paris. We would of hooked up Munich but ran out of meters:

Analog Tweet-O-Meter from Benjamin Blundell on Vimeo.


All it needs now is a brass case and an 'on/off' handle...

Currently in beta and part of our wider 'Ask' tool it allows anyone to 'mine' data from Twitter or carry out a survey of either the world, a continent, a nation, a city or a local area. In short, we think it has notable potential for social science and the analysis of trends and relationships in a variety of areas.

We have run various beta tests on data collection with the main mining process starting next week over a 24 hour period. We aim to collect all tweets with a geo-location tag in the above cities, this is a large amount of data allowing various social, spatial and temporal analysis to be carried out.

The system is under development here at CASA as part of a wider survey tool as part of the NeISS project being coded by Steven Gray in association with Urban Tick, currently carrying out analysis on the data sampled so far.

See http://www.casa.ucl.ac.uk/tom/ to view the Tweet-o-Meter, we should have some early analysis soon and graphs for the cities within the next day or so.
For those too young or perhaps simply nostalgic for the late 70's/early 80's hit that inspired the work, here is PopMusik via YouTube (its great...).

Thanks go to Ben and Steven for their work on this - see Bens http://www.section9.co.uk/, and Stevens http://stevenjamesgray.com/ for more info on their work both inside and outside of CASA time. Thanks also go to Russ Garrett (russ.garrett.co.uk/) and the London Hackspace for help with the code.

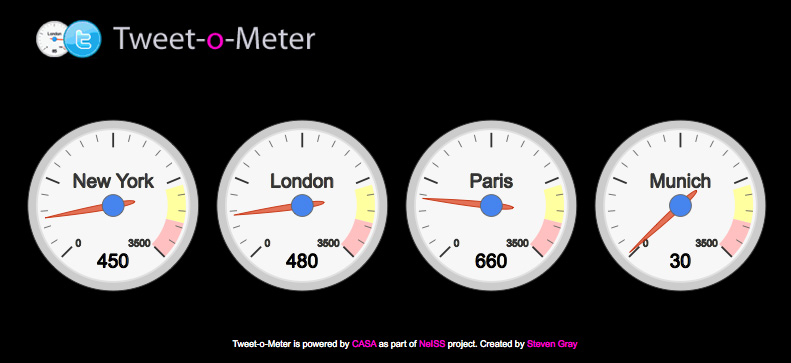
New York, London, Paris, Munich: Tweets Per Minute via our new Tweet-o-Meter

‘New York, London, Paris, Munich everybody talk about Pop Musik’ – that was 1979 and the catch line by the group M. As such we thought it would be interesting to mine what people are talking about in 2010.

We are planning to log all geolocated Tweets in NewYork, London, Paris and Munich over a 24 hour period via the Twitter API as part of research under the NeISS project in association with UrbanTick and ourselves here at Digital Urban, part of CASA, University College London.


The system is running in beta mode over the next week with visualisation of the Tweets per Minute provided via our Tweet-o-Meter. While the reference to the 1979 is all well and good the system is actually designed to mine data for later analysis relating to further our understanding of the social and temporal dynamics of cities within the Twitter demographic. These can be mapped allowing us to capture 24 hours in the life of the city.

Below is an example of the type of base output we expect, as we are also extracting the social data and retweets we can map this in both time and space. UrbanTick has a nice tutorial on how to the do the timelapse of Tweets below:

London Weekend on Twitter from urbanTick on Vimeo.

Currently in beta mode the Tweet-o-Meter updates every 10 seconds displaying the city with the highest number of Tweets, the logged 24 hour period will be announced next week. Once collected we will be able to create city maps detailing the Tweet activity over time and space, a wider ranging system will be launched as part of a free data collection service via NeISS in the next couple of months.


See http://www.casa.ucl.ac.uk/tom/ to view New York, London, Paris, Munich via Tweet-o-Meter and if your in one of those cities and want to take part, simply make sure you have geolocation turned on in your Twitter preferences.

For those too young or perhaps simply nostalgic for the late 70's/early 80's hit that inspired the work, here is PopMusik via YouTube (its great...).